

DataMac Help (Legacy Product)
Online help for the offline database.
DataMac.net used to be provided as an Access database. This page is the documentation that goes along with the general product that may still be out there and in use.

Deliverable: Microsoft Access Database
Updates: Depends on Product
DataMac Menu
DISPLAY GRAPHS - Displays the graph window where you can set graph criteria and generate graphs.
QUERIES & REPORTS - Displays a control panel window where you have the ability to output different results (e.g., population by components) and preview/print different reports.
SETTINGS/OPTIONS - Displays a window where you can change some settings/options regarding the database (e.g., initialization key).
DATABASE DEFINITIONS - Displays an informative page where you can see descriptions/definitions about stuff included in the database (e.g., components, vocations).
DATAMAC HELP WEB SITE - Displays the entire help about the DataMac database.
EXIT DATABASE - Quits the DataMac database.
DISPLAY GRAPHS
This is the window where you can display different types of graphs based on selected graph parameters and criteria.
The right portion of this window is like a small control panel where the user can choose different graph parameters or change the graph criteria and click on the Graph button to display the graph.
PARAMETERS
Graph Type: Column, Bar, Pie, Line Select the type of chart to be displayed.

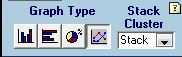


Column Value: Show the numbers by $ value or # of units.
Stack or Cluster By: If using column or bar chart, select the extra group by.
Graph Data by: Drop down determines which data segmentation the graph will display along the X-axis of the column graph, along the Y-axis of the bar graph, or in the slices of the pie graph.
Graph Source: May not be multiple sources unless subscription was upgraded to include additional market segmentation.
Once the parameters have been selected, click on the Graph or GO Button at the top right.

Graph Criteria Button
The Graph Criteria Pop-Up allows you to select any combination of components. You can directly select components one-by-one in the component list on the Components Tab, or you can select whole groups of components with the checkboxes to the right on the Components Tab. You can also select sub-groups of components by clicking on the Open SubGroup button, which opens the SubGroup Graph Criteria Pop-Up.
The radio buttons under Graph Data by determine which "cut" of the data the graph will use. The choice of radio button will also alter the Stack or Cluster by and Graph Data by drop downs on the main screen by making that cut of the data available as an option. The middle tab will also change according to the radio button selected, and this middle tab will allow you to select which sub-divisions you want the graph to use in its results. The Years Tab operates in the same capacity.
Standard Access sorting and filtering can be used on the component list by Right-Clicking on one of the six columns: Grp (Component Group), SGrp (Component SubGroup), Vcls (Vehicle Class), the "selected" checkbox, ID (Component ID), and Component Name
Other Features
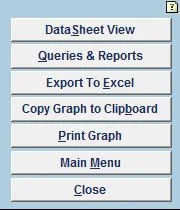
DataSheet View - Use this button to display the data in DataSheet view. You can copy-and-paste the data from DataSheet View to another application such as an Excel spreadsheet.
Queries & Reports - Brings you to a different menu of Queries and Reports to preview. When done, In that pop-up window, you can extract different reports based on components and specific year. To change the selections for the report outputs, click on Graph Criteria Popup button go get the Component List to appear again.
Export to Excel - This button exports the underlying data to an Excel file. When you click on this button, the Save dialog box will appear giving you the ability to chose the location where you would like to save the excel file. The name of the excel file is unique to prevent from overwriting the previously outputted excel files.
Copy Graph to Clipboard - The Copy Graph to Clipboard function works like any other Windows copy function. Clicking on this button will copy the current screen graphic to the clipboard. The paste function in the edit menu of any other program (i.e., word processor) will paste the graphic.
Queries & Reports

The button options may vary depending on product. The labels should be self explanatory. To change the components or other options for the reports, click on the Graph Criteria button within that form to get back to changing the Graph Criteria options. The two buttons connected with red lines are equivalent. Having one in the Queries & Reports form allows you to change options without exiting the Queries & Reports.